Solutions de Cartographie Ouverte
Chez HOT, nous utilisons une combinaison d'outils de cartographie ouverte développés par la communauté open source pour créer, accéder, gérer, analyser et partager des données cartographiques ouvertes qui servent nos partenaires et les communautés locales.
Vous pouvez explorer ci-dessous des outils pour vos flux de travail de données et vos projets de cartographie du début à la fin. Tous les outils ci-dessous sont soit open source, soit liés à la promotion des données ouvertes. OpenStreetMap (OSM) et d'autres outils géospatiaux ouverts sont inclus pour promouvoir la cartographie ouverte et gratuite dans tous les contextes, y compris les environnements aux ressources limitées. Les outils de HOT, qui comblent une niche dans les flux de travail de cartographie de bout en bout, sont marqués.
Imagerie & Observation de la Terre
Les données de capteurs englobent les informations obtenues via diverses plateformes pour capturer des données de référence du monde réel.
- Données satellitaires, principalement bénéfiques pour les solutions à grande échelle.
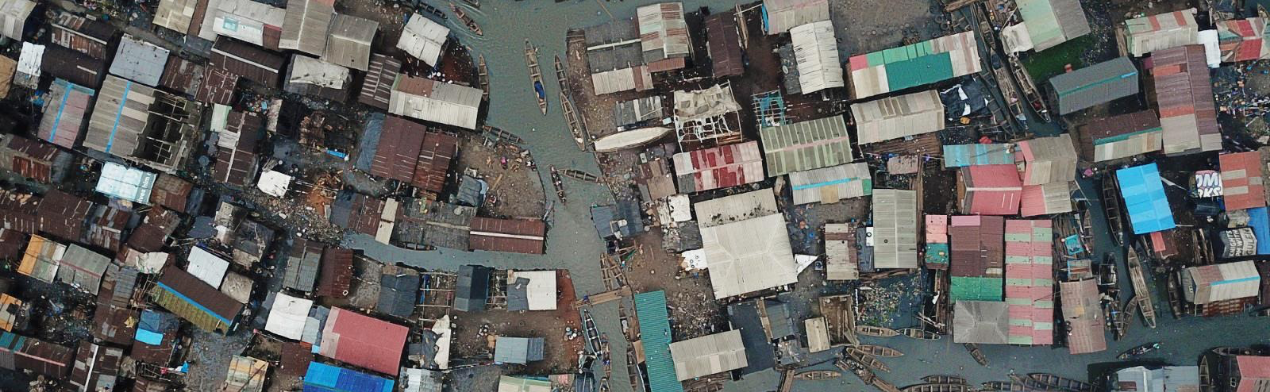
- Données de drones ou d'avions, présentent des opportunités prometteuses pour les initiatives communautaires grâce à l'imagerie par drone.
- Données terrestres, provenant de téléphones, de voitures, etc., servent d'entrée à des fins de cartographie, comme l'illustrent des jeux de données tels que les données Mapillary et les photos de téléphone.
Open Aerial Map (OAM)
La collection ouverte d'imagerie aérienne.
À propos
OpenAerialMap est un service ouvert pour fournir un accès à un bien commun d'imagerie sous licence ouverte et de services de couches cartographiques. Téléchargez ou contribuez avec des images au bien commun grandissant d'imagerie sous licence ouverte.
OpenAerialMap crée un espace pour que les cartographes stockent et partagent leur travail avec le reste de la communauté. Grâce à cette base de données, chacun a un point de départ pour commencer à aider, qu'il s'agisse de pilotes de drone dans des zones de crise, ou de cartographes souhaitant tracer depuis chez eux.
Programme Maxar Open Data
Imagerie satellitaire pour certains événements de crise majeure à déclenchement soudain.
À propos
Le programme Open Data est notre objectif en action. Maxar Intelligence soutient la grande communauté géospatiale en fournissant des images satellitaires avant et après les catastrophes. Les organisations travaillant en première ligne augmentent leur impact et leur efficacité en ayant accès à ces données.
Lorsque des crises surviennent, Maxar s'engage à soutenir la communauté humanitaire en fournissant des informations critiques et exploitables pour aider les efforts de réponse. Les images associées sont publiées dans le domaine public sous une licence Creative Commons 4.0, permettant une utilisation rapide et une intégration facile avec les technologies humanitaires de réponse existantes. (source : site web)
Critères d'Activation
- Catastrophe naturelle à déclenchement soudain.
- Catégorisé comme un événement majeur basé sur l'étendue géographique, l'impact humanitaire et l'estimation des besoins.
- Le service d'événement FirstLook a été activé.
Planet
Planet fournit des informations géospatiales à la vitesse du changement, équipant les organisations avec les données nécessaires pour prendre des décisions éclairées et opportunes. Avec une imagerie de premier ordre, vous pouvez surveiller les zones d'intérêt, valider les informations sur le terrain et découvrir des tendances pertinentes pour votre organisation.
À propos
En soutien à la Charte Internationale Espace et Catastrophes Majeures, Planet met à disposition du public, des volontaires, des organisations humanitaires et d'autres organismes de coordination des images des zones sinistrées à travers le monde. Les données de catastrophe sont sous licence ouverte Creative Commons : CC-BY-SA pour un usage commercial, et CC-NC-BY pour un usage non commercial.
Les données de catastrophe sont disponibles pour toute personne disposant d'une clé API Planet : apprenez comment obtenir votre propre clé API ici, ou en savoir plus sur Planet Disaster Data. (source : site web)
Fonctionnalités
- Bibliothèque Python & CLI : Le package Python planet est une bibliothèque cliente Python et une interface en ligne de commande sous licence Apache 2.0 pour travailler avec l'API publique de Planet.
- Jupyter Notebooks : L'équipe Expérience Développeur de Planet a créé une collection de Jupyter Notebooks sous licence Apache 2.0, ainsi qu'une image Docker qui facilite l'exécution de votre propre instance Jupyter compatible géospatiale.
- Plugin QGIS : Le plugin de Planet pour QGIS, qui permet aux utilisateurs de QGIS de découvrir, diffuser en flux et télécharger l'imagerie Planet, est également open source sur Github de Planet.
Copernicus
Les yeux de l'Europe sur la Terre : Observer notre planète et son environnement au bénéfice des citoyens européens.
À propos
Copernicus Data Space Ecosystem, un écosystème ouvert qui fournit un accès instantané gratuit à un large éventail de données et services des missions Sentinel de Copernicus et plus encore sur les terres, océans et atmosphère de notre planète. (source : site web)
Fonctionnalités
- Explorer les données : Accédez à un large éventail de données d'observation de la Terre des missions Sentinel de Copernicus et plus. L'écosystème Copernicus Data Space fournit des outils pour une découverte, visualisation et téléchargement faciles, qui seront continuellement améliorés.
- Copernicus Browser : Le service fournit un environnement puissant d'analyse de données. Accédez à un ensemble d'outils de traitement de données de haute qualité pour extraire des informations précieuses pour mener des activités publiques, privées ou commerciales. L'écosystème Copernicus Data Space est conçu pour être le prochain niveau d'infrastructure de traitement et de distribution des données utilisateur.
- Collections de données : L'écosystème Copernicus Data Space est l'étape suivante dans l'évolution des données d'observation de la Terre. L'écosystème vise à rassembler des outils et des ressources pour libérer tout le potentiel de ces données. Cela permet de construire un écosystème dynamique, ouvert et en expansion pour accroître l'impact des données d'observation de la Terre pour une société durable.
NASA Earth Data
Votre Portail vers les Données d'Observation de la Terre de la NASA
À propos
Le programme Earth Science Data Systems (ESDS) fournit un accès complet et ouvert à la collection de données scientifiques de la Terre de la NASA pour comprendre et protéger notre planète. Commencez votre exploration Earthdata en cliquant sur l'une des icônes de discipline ci-dessus. (source : site web)
Fonctionnalités
- Commencer : Le site web Earthdata de la NASA est votre portail vers l'un des plus grands dépôts de données d'observation de la Terre de la planète. Ces données – ainsi que les outils pour les analyser et les utiliser – vous sont disponibles pleinement, ouvertement et sans restriction.
- Trouver des données : La NASA acquiert, archive et distribue des données provenant de diverses sources, notamment des instruments de télédétection sur plateformes satellitaires et aériennes, des campagnes sur le terrain, des mesures in situ et des sorties de modèles.
- Utiliser les données : Earthdata fournit un certain nombre de ressources pour accéder et utiliser les données, y compris des outils pour visualiser des images et créer des visualisations de données.
Mapillary
Accédez à des images au niveau de la rue et à des données cartographiques du monde entier. Comblez les lacunes en capturant vous-même la couverture.
À propos
Mapillary rassemble un réseau mondial de contributeurs qui souhaitent rendre le monde accessible à tous en visualisant le monde et en construisant de meilleures cartes. Tout le monde peut rejoindre et collecter des images au niveau de la rue, en utilisant des outils simples comme des smartphones ou des caméras d'action. Grâce à la vision par ordinateur, nous connectons les images à travers le temps et l'espace pour créer des vues immersives au niveau de la rue et extraire des données cartographiques. (source : site web)
Fonctionnalités
- N'importe quelle caméra, n'importe où : Capturez des images avec n'importe quel type de caméra pour mettre des lieux sur la carte grâce à une vue collaborative au niveau de la rue du monde.
- Modifiez les cartes avec un nouveau point de vue : Mettez à jour les cartes avec des détails qui ne sont pas visibles depuis les images aériennes, en utilisant des images au niveau de la rue provenant de n'importe où où vous en avez besoin.
- Laissez les machines accélérer les choses : Mettez à jour les cartes plus rapidement et avec moins d'effort en utilisant des éléments cartographiques extraits par vision par ordinateur.
- La collaboration l'emporte toujours : Ouvrez les données pour aider tout le monde à prendre de meilleures décisions concernant les villes et les routes, la mobilité et la navigation, et la conduite autonome.
Collecte de Données : à Distance
La cartographie à distance permet la création de données d'une zone d'intérêt depuis n'importe où dans le monde. Les utilisateurs utilisent des images de base pour identifier des éléments comme les bâtiments, les routes, les cours d'eau, etc., et les intégrer dans des bases de données géospatiales, comme OpenStreetMap. La cartographie à distance peut couvrir de vastes zones efficacement, et les informations identifiées éclairent la prise de décision sur le terrain. De multiples outils connectés à OpenStreetMap permettent une collaboration organisée et le crowdsourcing de collectes et créations massives de données, ainsi que des efforts d'amélioration des données.
Tasking Manager
Join a global community that is mapping the places most vulnerable to disaster and poverty in order to support humanitarian aid and sustainable development across the world.
About
Each year, disasters around the world kill nearly 100,000 and affect or displace 200 million people. Mapping can help change this. Organizations use Tasking Manager to create mapping projects for areas around the world where data is needed to help save or improve lives.
Features
- Mapping: Volunteers use satellite imagery from OpenStreetMap to trace buildings, roadways, and other features.
- Validation: Experienced volunteers check the map data to ensure it is high quality.
- Using the data: Humanitarian organizations use the map data to plan for disaster response and other life saving activities.
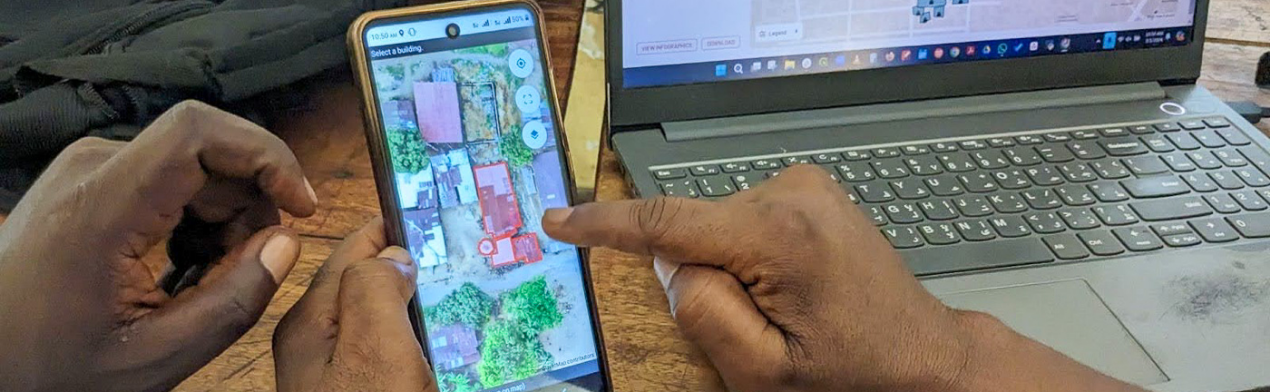
fAIr: AI Assisted Mapping
- f: for freedom and free and open-source software
- AI: for Artificial Intelligence
- r: for resilience and our responsibility for our communities and the role we play within humanitarian mapping
About
fAIr is an open AI-assisted mapping service developed by the Humanitarian OpenStreetMap Team (HOT) that aims to improve the efficiency and accuracy of mapping efforts for humanitarian purposes. The service uses AI models, specifically computer vision techniques, to detect objects such as buildings, roads, waterways, and trees from satellite and UAV imagery. (source: website)
Features
- Goal is to provide AI-assisted mapping across mobile and in-browser editors using community-created models, enhancing relevance to improve living conditions.
- Utilizes open-source AI models trained by local communities.
- Uses open-source satellite and UAV imagery from HOT's OpenAerialMap (OAM) for feature detection and suggestions to OpenStreetMap (OSM).
- Offers free and open-source service, allowing OSM community members to create and train their own AI models for mapping.
- Receives constant feedback from local communities to progressively refine models, suggesting detected features for addition to OSM while avoiding mass imports. Corrections made by OSM mappers further enhance model accuracy.
Rapid
Rapid is a web-based modern editor for OpenStreetMap. Rapid integrates advanced mapping tools, authoritative geospatial open data, and cutting-edge technology to empower mappers at all levels to get started quickly, making accurate and fresh edits to maps.
About
Rapid is enhanced with authoritative open data sources and AI-generated roads from the Facebook Map With AI service and buildings from Microsoft open buildings dataset to make adding and editing roads, buildings, and more quick and simple.
Rapid also includes data integrity checks to ensure that new map edits are consistent and accurate.
Features
- Map Faster: The new Rapid editor saves you the effort of manually drawing map geometry by tapping into open data or predicted features identified by artificial intelligence.
- Map Better: AI-analyzed satellite imagery gives you a high-level overview of unmapped and missing data around the globe.
- Machine Learning: Rapid displays open map data and machine learning detections.
MapRoulette
Thousands of people just like you edit OpenStreetMap every day
About
MapRoulette has dozens of mapping challenges that are created by experienced mappers. Each challenge is about improving OSM in one very specific way. Do you want to add pedestrian crossings? Fix bridges? Add opening times for shops? There’s a challenge for it. Each challenge has many tasks, perhaps even thousands.
Do as few or as many as you want. If a challenge is too easy or too hard for you, just jump into something else, knowing that every time you click ‘I fixed it!’, you have made a meaningful contribution to the world’s maps. (source: website)
Features
- Work at your own level, from novice to expert.
- Find mapping tasks that are important to you.
- Create tasks for others to improve OSM together.
MapSwipe
Volunteer from your phone. Make a difference worldwide.
About
MapSwipe harnesses the collective strength of volunteers to actively contribute to geospatial data projects. From identifying infrastructure to tracking environmental changes and validating map data, MapSwipers help improve map data across the world.
As a result, our MapSwipe partners are better equipped and informed to engage and support communities globally. (source: website)
Features
- Find: Swipe through satellite images to identify & select those that contain the requested features such as buildings, roadways, waterways and more.
- Compare: Review before and after satellite images to detect changes in the environment that help inform damage assessment, climate change, or inaccurate data.
- Validate: Assess building footprints for accuracy where buildings have been previously traced by remote mappers or through AI to identify where remapping is needed.
Data Collection: Field

Add depth to extracted data by incorporating critical local knowledge, which is often absent in sensor data and requires human input for accuracy. For instance, details like doctor availability in hospitals or vulnerability to disasters are best verified locally. Local field mapping plays a pivotal role in prioritizing community involvement.
Field-TM
Coordinated field data collection: Similar to HOT’s remote Tasking Manager, Field-TM reduces duplication of missing areas. Field-TM facilitates collaborative mapping by supporting and extending existing ODK based mature tools.
About
Feature locations in OpenStreetMap and other open spatial datasets are nearing global coverage, but detailed information on mapped features is still lacking. Information such as feature names, materials, or condition are best mapped on the ground by local community members and requires coordination at scale. (source: website)
Features
- Project coordination: Field-TM applications improve the mapping productivity (mapped features/person-day) by reducing the duplication of efforts and avoiding missed areas by allocating task areas to mappers.
- Field data collection: Unlike other ODK based platforms, Field-TM is intended for adding attributes to existing geographical features such as buildings or Points of Interest (POIs).
- Data upload and validation: Field-TM improves data quality by including a validation mechanism, that ensures data completeness and interoperability.
Mapillary
Access street-level imagery and map data from all over the world. Fill in the gaps by capturing coverage yourself.
About
Mapillary brings together a global network of contributors who want to make the world accessible to everyone by visualizing the world and building better maps. Anyone can join and collect street-level images, using simple tools like smartphones or action cameras. With computer vision, we connect images across time and space to create immersive street-level views and extract map data. (source: website)
Features
- Any camera, anywhere: Capture imagery with any kind of camera to put places on the map through a collaborative street-level view of the world.
- Edit maps with a new point of view: Update maps with details that are not visible from aerial images, using street-level imagery from anywhere you need it.
- Let machines speed things up: Update maps faster and with less effort by using map features extracted with computer vision.
- Collaboration always wins: Open up data to help everyone make better decisions about cities and roads, mobility and navigation, and autonomous driving.
Open Data Kit (ODK) Collect
ODK lets you build powerful forms to collect the data you need wherever it is.
About
ODK Collect is an Android app for filling out forms. It is designed to be used in resource-constrained environments with challenges such as unreliable connectivity or power infrastructure. ODK Collect is part the ODK project, a free and open-source set of tools which help organizations author, field, and manage mobile data collection solutions. (source: website)
Features
- Build powerful forms: Include photos, GPS locations, skip logic, calculations, external datasets, multiple languages, and more.
- Works online and offline: Use either the mobile app or the web app. Your data is automatically synced when an Internet connection is found.
- Analyze with ease: Download your data or connect apps like Excel, Power BI, Python, or R to create real-time dashboards.
- Open-source software: ODK puts you in complete control of your data collection. Use as is or customize as you see fit.
Organic Maps
About
Organic Maps is a community-developed, privacy-focused and offline navigation app [that lets you add data to OpenStreetMap].
This app has the main features of no location tracking and no data collection. The map data is downloaded to the phone so search, routing, and navigation can operate without a cell phone signal, ideal for travel to locations with poor connections. Organic Maps uses the crowdsourced map data from OpenStreetMap. (source: website)
Features
- Detailed offline maps with places that don't exist on other maps, thanks to OpenStreetMap.
- Lets you add data to OpenStreetMap.
- Contour lines, elevation profiles, peaks, and slope.
- Export/import bookmarks in KML/KMZ, import GPX.
- Free and open-source.
OsmAnd
About
OsmAnd is a map and navigation app for Android and iOS. It uses the OpenStreetMap map database for its primary displays, but is an independent app not endorsed by the OpenStreetMap Foundation. It is available in both free and paid versions; the latter unlocks the download limit for offline maps and provides access to Wikipedia points of interest and their descriptions from within the app. (source: website)
Features
- Map: Carry highly detailed, fully offline maps of any region world wide on your device.
- Navigation: Works totally offline.
- Open Source: Compact offline vector maps.
- Open-source software: ODK puts you in complete control of your data collection. Use as is or customize as you see fit.
StreetComplete
About
This app finds missing map data in your vicinity and displays it on a map as quests. Solve each quest by visiting the location on-site and answering a simple question to update the map.
The app is made specifically for casual contributors and beginners as no prior knowledge about OpenStreetMap (such as tagging schemes) is required to contribute with this app. Furthermore, there is a bit of gamification and statistics that aim to introduce and try to inspire users to venture deeper into the world of OpenStreetMap. (source: website)
Ushahidi
About
Ushahidi is an open source software application which utilises user-generated reports to collate and map data. It uses the concept of crowdsourcing serving as an initial model for what has been coined as “activist mapping” – the combination of social activism, citizen journalism and geographic information.
Ushahidi allows local observers to submit reports using their mobile phones or the Internet, creating an archive of events with geographic and time-date information.
(source: website)
Features
- Holistic data gathering platform & integrated tools: The Ushahidi Platform brings together multiple data-gathering tools and services to save time and simplify processes, allowing users to focus on their goals and objectives rather than the tools that help achieve them.
- Accessible, easy-to-use and open-source: Our Platform is intended to be used by anyone, anywhere, and is flexibly built using a mobile-first approach to ensure device and network compatibility around the world. We also make our tools open-source in the spirit of improving technology accessibility and affordability to all.
- Available globally in dozens of languages: With deployments in more than 160 countries and over 40 languages, the Ushahidi Platform provides value and helps communities achieve solutions around the world.
Data Analysis and Open Data Insights
Connecting data to real-world decisions comes through data manipulation and exploration. The tools below allow users to examine the content and availability of OpenStreetMap data, and to analyze it to solve current local challenges.
QGIS
A free and open source geographic information system.
About
QGIS, or Quantum GIS, is an open-source geographic information system (GIS) software that allows users to create, edit, visualize, analyze, and publish geospatial information. It provides a wide range of tools for working with geographic data, including mapping, spatial analysis, and data visualization. QGIS supports various data formats and projections, making it suitable for a diverse range of applications, from environmental management and urban planning to agriculture and disaster response. It is widely used by individuals, organizations, and governments for its flexibility, ease of use, and extensive community support. (source: website)
Features
- Data visualization and mapping: QGIS facilitates creation of customizable, visually appealing maps with diverse data layers.
- Spatial analysis tools: Offers a suite of tools for comprehensive spatial analysis, supporting tasks like proximity and overlay analysis.
- Plugin architecture: Its plugin architecture enables users to enhance functionality with a wide range of community-developed plugins, tailored to specific tasks and workflows.
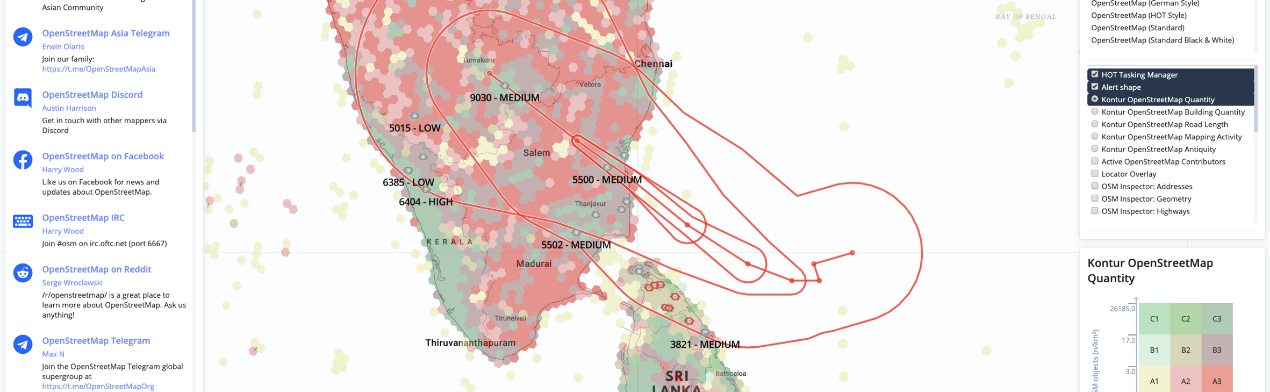
Disaster Ninja
A mapping tool for rapid geospatial decision making.
About
Disaster Ninja is a critical event management solution that provides information about recent natural disasters, visualizes mapping gaps, and helps you connect with locals for ground truth verification.
While you cannot map new objects in Disaster Ninja directly, the tool enables humanitarian organizations to prepare and prioritize new tasks for subsequent mapping rapidly. Swift and reliable decisions about when and where to start mapping can save precious time for disaster response during a crisis. (source: website)
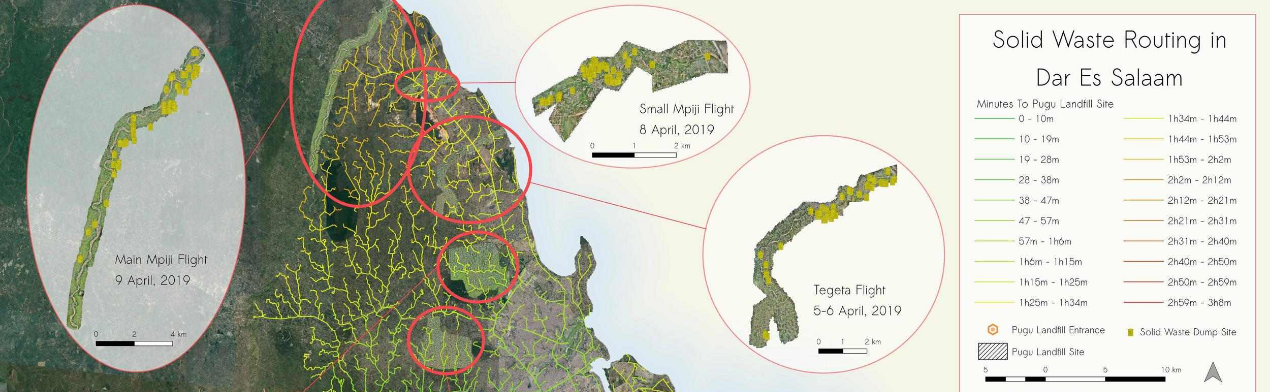
Kepler
Make an impact with your location data. Kepler.gl is a powerful open source geospatial analysis tool for large-scale data sets.
About
Kepler.gl is a data-agnostic, high-performance web-based application for visual exploration of large-scale geolocation data sets. Built on top of MapLibre GL and deck.gl, kepler.gl can render millions of points representing thousands of trips and perform spatial aggregations on the fly.
Kepler.gl is also a React component that uses Redux to manage its state and data flow. It can be embedded into other React-Redux applications and is highly customizable. For information on how to embed kepler.gl in your app take a look at this step-by-step tutorial on vis.academy. (source: website)
Observable Framework
Observable Framework — or “Framework” for short — is an open-source static-site generator for data apps. By data app we mean an application that is primarily a display of data. Data apps help you derive insights (to understand) and evaluate potential decisions (to take action).
About
Good data apps are highly customized — they present an opinionated perspective and reflect your brand. Point-and-click tools may be easy to use but suffer from limited expressivity and power. With code, there’s no limit to what you can create. (See our D3 and Plot galleries for inspiration)
Modern development is a marvel. Framework is free and open-source, and projects are just local files, making it easy to incorporate into your existing workflow. Use your preferred editor, source control, and code review system. Write unit tests. Run linters. Automate builds with continuous integration or deployment. Work offline. Self-host. Generate or revise content programmatically with AI. You can do it all. (source: website)
Data Visualization
All data tells a story, and through visualization, that story turns into a message. Data visualization communicates complex spatial dynamics to inform real world decisions. The cartographic and other visualization tools featured here allow data to be more clearly communicated to key decision makers.
D3
The JavaScript library for bespoke data visualization. Create custom dynamic visualizations with unparalleled flexibility.
About
D3 (or D3.js) is a free, open-source JavaScript library for visualizing data. Its low-level approach built on web standards offers unparalleled flexibility in authoring dynamic, data-driven graphics. For more than a decade D3 has powered groundbreaking and award-winning visualizations, become a foundational building block of higher-level chart libraries, and fostered a vibrant community of data practitioners around the world. (source: website)
Healthsites
About
When a natural disaster or disease outbreak occurs there is a rush to establish accurate health care location data that can be used to support people on the ground.
This has been demonstrated by events such as the Haiti earthquake and the Ebola epidemic in West Africa. As a result valuable time is wasted establishing accurate and accessible baseline data. Healthsites.io establishes this data and the tools necessary to upload, manage and make the data easily accessible. (source: website)
Features
- Data model: Each healthsite is stored as a geometry object in the database.
- Share healthsite data: Please contact us should you wish to share data and we will assist you.
MapLibre
About
MapLibre are a set of open-source SDKs for developing web and mobile applications developed by a community of companies and freelance developers. (source: website)
Features
- MapLibre GL JS: Open-source TypeScript library for publishing maps on your website. Great performance due to GPU-accelerated vector tile rendering.
- MapLibre Native: Open-souce C++ library for displaying maps inside of your mobile applications, desktop application, or embedded devices. GPU-acceleration through OpenGL and Metal.
- MapLibre RS: Experimental portable and performant vector maps renderer based on WebGPU and Rust, with web support though WebAssembly.
uMap
About
uMap lets you create maps with OpenStreetMap layers in a minute and embed them in your site. (source: website)
Features
- Choose the layers of your map.
- Add POIs: markers, lines, polygons.
- Manage POIs colours and icons.
- Manage map options: display a minimap, locate user on load.
- Batch import geostructured data (geojson, gpx, kml, osm...).
- Choose the license for your data.
- Embed and share your map.
Open Data Access & Sharing
Accessing and using pre-existing geospatial datasets can be challenging due to the different sources and use licenses associated with them. Projects like OpenStreetMap (OSM), a global, open, and crowdsourced dataset, allow users to access their data and utilize it for a variety of purposes. Accessing OSM data in an easy to use format is accessible through the following tools.
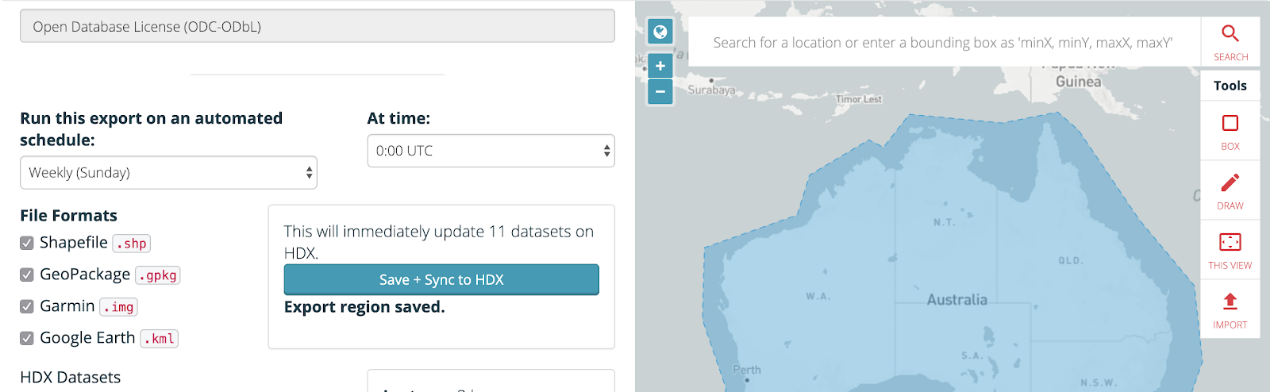
Export Tool
Download OpenStreetMap data.
About
The Export Tool is an open service that creates customized extracts of up-to-date OSM data in various file formats. Download and use the data simply by crediting the OpenStreetMap contributors.
Features
- Customized data exports: Generate customized exports of OpenStreetMap data tailored to specific geographic regions and thematic needs, supporting humanitarian and disaster response efforts.
- Flexible output formats: Flexibility in output formats, enabling users to export data in various formats such as shapefiles, GeoJSON, and OSM XML, facilitating compatibility with different GIS software and analysis tools.
- Live database: Access to up-to-date OpenStreetMap data, allowing users to access the latest information for their mapping and analysis tasks in humanitarian contexts, ensuring relevance and accuracy in decision-making processes.
Raw Data API
About
Raw Data API is a set of high-performant APIs for transforming and exporting OpenStreetMap (OSM) data in different GIS file formats. (source: website)
Features
- Built on top of FastAPI.
- OAUTH 2.0 Authentication with OpenStreetMap(OSM).
- Multiple GIS formats support via GDAL's ogr2ogr - (supported formats: Esri Shapefile, KML, Mbtiles, FlatGeoBuf, CSV, GeoPackage, PGDUMP, GeoJSON, Pmtiles, MVT, MBTiles). Out of which, GeoJSON Follows Own Raw Data API conversion script.
Humanitarian Data Exchange (HDX)
About
The Humanitarian Data Exchange (HDX) is an open platform for sharing data across crises and organisations. Launched in July 2014, the goal of HDX is to make humanitarian data easy to find and use for analysis. Our growing collection of datasets has been accessed by users in over 250 countries and territories.
HDX is managed by OCHA's Centre for Humanitarian Data, which is located in The Hague, the Netherlands. OCHA is part of the United Nations Secretariat and is responsible for bringing together humanitarian actors to ensure a coherent response to emergencies. The HDX team includes OCHA staff and a number of consultants, based in North America, Europe, Africa, the Middle East and Asia. (source: website)
Overpass Turbo
Overpass turbo (overpass-turbo.eu) is a web based data mining tool for OpenStreetMap.
About
It runs any kind of Overpass API query and shows the results on an interactive map. Using it can get technical quite quickly: beginners may find the "wizard" a good place to start.
This project is maintained by Martin Raifer. The source code is found on GitHub. A huge thanks goes to Roland who created the Overpass API, without which this tool wouldn't exist. (source: OSM Wiki)